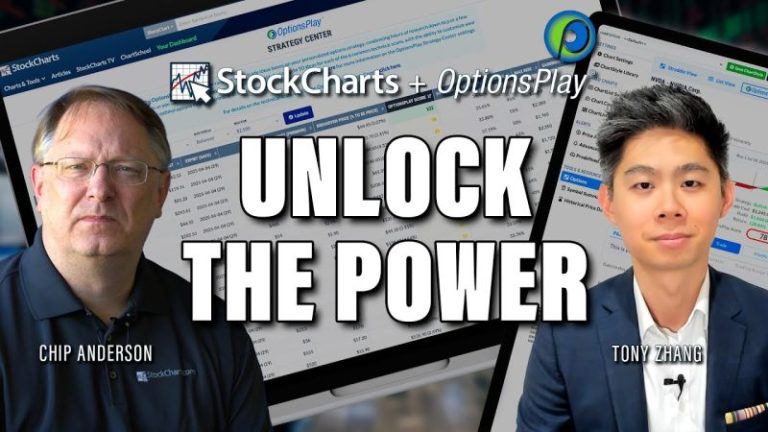
In this video, Chip Anderson, President of StockCharts, sits down with Tony for a conversation in the StockCharts studio! During this in-depth Q&A session, Chip and Tony explore the powerful features that make the OptionsPlay add-on a must-have for options traders using the StockCharts platform. They discuss the integration of the StockCharts Scanning Engine with OptionsPlay strategies—showcasing how this tool enhances your ability to find trade setups quickly and effectively.
In this must-see market update, Larry Williams returns with timely stock market analysis, trading insights, and macroeconomic forecasts. Discover what’s next for the Federal Reserve, interest rates, and inflation — and how it could impact top stocks like Tesla (TSLA), Nvidia (NVDA), Apple (AAPL), and consumer staples (XLP).
Larisa Sprott of Sprott Money and Argo shares her thoughts on the gold and silver markets, saying she sees the ‘smart money’ continuing to gravitate toward these metals.
In her view, price dips present a chance to get in at lower levels.
Securities Disclosure: I, Charlotte McLeod, hold no direct investment interest in any company mentioned in this article.
Alzheimer’s disease treatment stocks are focused on Alzheimer’s disease, a degenerative brain disorder that results in declining memory and thinking skills and typically affects people in their mid-60s.
According to the Alzheimer’s Association, neurons in other areas of the brain also begin to deteriorate as Alzheimer’s disease gets worse, resulting in the loss of basic human functions and overall cognitive impairment.
This condition affects more than 7 million people in the US alone; it’s also the most common form of dementia and is the seventh leading cause of death in America. Treatments are available to alleviate Alzheimer’s disease symptoms, but there are currently none that affect the underlying causes of this neurodegenerative disease.
Alzheimer’s disease therapies that have been approved by the US Food and Drug Administration (FDA) include: rivastigmine by Novartis (NYSE:NVS); galantamine, developed by Janssen, a division of Johnson & Johnson (NYSE:JNJ); donepezil by Pfizer (NYSE:PFE); and memantine by AbbVie (NYSE:ABBV).
Since there is no cure for Alzheimer’s disease, death is often the result for patients as the ailment causes brain deterioration. And unfortunately, Alzheimer’s disease is rising in prevalence — a report from Grand View Research suggests that the global Alzheimer’s disease treatment market will be worth a significant US$15.57 billion by 2030 as more patients need treatment, and as more investments are made in biomarkers for diagnosis and drug development.
The first NASDAQ-listed Alzheimer’s drug company on this list is Massachusetts-based Biogen, a pioneer in the field of neuroscience. The firm is focused on developing, manufacturing and marketing therapies aimed at treating serious neurological, neurodegenerative, autoimmune and rare diseases.
The global biotechnology firm’s research areas include Alzheimer’s disease and dementia. However, the launch of Biogen’s FDA-approved Alzheimer’s disease drug Aduhelm faced a lot of pushback in 2022, both from the market and from Congress, over what was viewed as a hasty fast-track approval process and exorbitant costs to patients.
Biogen gave it another go with Leqembi (lecanemab-irmb), its amyloid-beta monoclonal antibody for the treatment of Alzheimer’s disease, which the FDA approved in 2023 under its accelerated approval pathway. The drug was jointly developed by Biogen and Tokyo-based pharmaceutical company Eisai (OTC Pink:ESALF,TSE:4523). It is for patients with mild cognitive impairment or mild dementia, and is the first drug shown to slow the progression of Alzheimer’s disease to win FDA approval.
In January 2025, Leqembi received another FDA approval, this time for intravenous maintenance dosing for early-stage Alzheimer’s. Later, in April, the European Commission granted Leqembi Marketing Authorization in the EU for the treatment of mild early-stage Alzheimer’s disease.
That same month, the FDA granted fast track designation to Biogen’s investigational tau-targeting therapy BIIB080 for the treatment of Alzheimer’s.
Biogen’s earnings report for Q1 shows that first quarter global in-market sales of Leqembi reached approximately US$96 million, including US in-market sales of approximately US$52 million.
2. Acadia Pharmaceuticals (NASDAQ:ACAD)
Market cap: US$3.68 billion Share price: US$21.98
Acadia Pharmaceuticals specializes in neuroscience and neuro-rare diseases. The biotech’s product portfolio includes the first and only FDA-approved drug to treat hallucinations and delusions associated with Parkinson’s disease psychosis, as well as the first and only approved drug in the United States and Canada for the treatment of Rett syndrome.
Acadia’s clinical-stage pipeline includes drug candidates targeting Prader-Willi syndrome and Alzheimer’s disease psychosis.
The company expects to enroll its final patient in its RADIANT Phase 2 study of ACP-204 in Alzheimer’s disease psychosis by early 2026 and release topline data in mid-2026.
According to the company, there are currently no approved treatments for hallucinations and delusions associated with Alzheimer’s disease psychosis.
3. Anavex Life Sciences (NASDAQ:AVXL)
Market cap: US$642.85 million Share price: US$7.53
Anavex Life Sciences is a clinical-stage biopharmaceutical company developing treatments for neurodegenerative, neurodevelopmental and neuropsychiatric disorders, such as Alzheimer’s disease, Parkinson’s disease, schizophrenia, Rett syndrome and other central nervous system disorders.
Anavex’ lead drug candidate, Anavex 2-73 (blarcamesine), has successfully completed Phase 2a and a Phase 2b/3 clinical trials for Alzheimer’s disease.
In early January, the company announced positive topline safety and efficacy data from more than three years of continuous treatment with blarcamesine for early Alzheimer’s disease patients. Later that month, Anavex announced it had been issued a US patent for the treatment.
Securities Disclosure: I, Melissa Pistilli, hold no direct investment interest in any company mentioned in this article.
Challenger Gold Limited (ASX: CEL) (‘CEL’ or the ‘Company’) is pleased to announce it has entered into an Investment Protection Agreement (“IPA” or “the Agreement”) with the Government of Ecuador for its 100% owned El Guayabo Project (“El Guayabo” or “the Project”). Under the terms of the IPA, the Government of Ecuador has granted CEL legal protections including stability of the regulatory framework, resolution of disputes through international arbitration, and protection of CEL’s investment.
The IPA covers US$75 million in investment from CEL encompassing expenditures from CEL’s initial acquisition of the project in 2019 and expenditure incurred until the end of 2027. It has an initial term of 8 years and is renewable. Key incentives and protections under the IPA include:
Regulatory stability and protection from changes to the current legal framework
The legal framework at the time of execution will continue to apply if the terms are more favourable to the project owner than any potential new framework
The IPA guarantees rights including non-discriminatory treatment, property protection, and legal certainty
International arbitration, should there be any disputes in relation to the Project, with the seat of arbitration in London under the rules of the International Chamber of Commerce
Commenting on the Investment Protection Agreement, CEL Managing Director, Mr Kris Knauer, said
“The completion of the Investment Protection Agreement is a significant development for the Project..
The IPA provides certainty with respect to the legal framework governing the Project, including stable mining regulations and fiscal terms, and security of title and investment for the term of the agreement. Additionally, it provides protection from all forms of confiscation and a mechanism for international arbitration should there be any disputes related to the project.
The IPA is also timely given recent corporate action in Ecuador as we take steps to monetise our Ecuador assets following the significant resource upgrade from 4.5 million ounce1 to 9.1 million ounces1,2,3.‘
McLaren Minerals Limited (ASX: MML) (‘McLaren’ or ‘Company’), is pleased to provide a further update on the phase 1 Drill Program at its wholly owned McLaren Titanium Project in the western Eucla Basin, Western Australia. This update is driven by the completion of geological interpretation of all the drilling during this campaign, in the absence of laboratory results.
Highlights
McLaren Titanium Project
192 drill holes completed for a total of 4,067 metres, on time and without incident
Significant extensions of prospective sediments outside of currently known resource boundaries observed during drilling:
North extension: approximately 2,200m wide, avg. 14m thick (max 23m),
Central zone eastern extension: 800m wide, avg. 20m thick (max 23m),
Metallurgical and geological samples submitted to IHC and Diamantina Laboratories
Geological work has improved confidence in deposit morphology and is expected to reduce future drilling costs
Strong community support confirmed within an established mining region
McLaren Mineral Sands Managing Director, Simon Finnis, commented:
“While we have not yet received any assays, phase 1 has delivered strong confidence to our team regarding this project. The most recent interpretation not only confirm the integrity of our geological model, but importantly, demonstrates the scale of the opportunity ahead. Defining substantial potential for mineralisation outside the current Resource boundary positions us well for future resource growth. We’ve also made solid ground operationally—drilling was completed on time, we’ve brought costs down, and we’re seeing strong local support. Taken together, these outcomes give us a great deal of confidence as we move toward the next phase of work and continue building long-term value for shareholders.”
Walmart agreed to pay a small fine and promised to ensure its third-party resellers are unable to sell realistic looking toy guns to buyers in New York, after state Attorney General Letitia James said Tuesday that the retail giant’s online store shipped them to the state.
The settlement comes nearly a decade after Walmart, Amazon, Sears and other retailers entered into a consent order and judgment with New York’s previous attorney general, in which they agreed to keep toy guns that resemble actual deadly weapons off their shelves statewide and they paid civil penalties that topped $300,000.
The 2015 order was part of a nationwide reckoning over realistic looking toy guns in the wake of the fatal shooting of Tamir Rice, a 12 year-old Cleveland boy who was killed by police in November 2014 while holding a pellet gun.
The New York law bans retailers from selling or shipping toy guns of certain colors — black, dark blue, silver, or aluminum — that look like real weapons.
A realistic-looking toy gun Walmart shipped to New York.New York Attorney General’s Office
Toy guns sold in the state must be “made in bright colors or made entirely of transparent or translucent materials,” with businesses subject to a fine of $1,000 per violation, according to James’ office.
James said on Tuesday that an investigation by her office found that Walmart’s online store had shipped at least nine realistic-looking toy guns sold by third-party sellers to New York City, Westchester County and Western New York.
But the investigation also found that between March 2020 and November 2023, at least 46 imitation weapons that violate New York state law were purchased by consumers in the state through the Walmart.com platform, the settlement revealed.
“Realistic-looking toy guns can put communities in serious danger and that is why they are banned in New York,” James said in a statement.
“Walmart failed to prevent its third-party sellers from selling realistic-looking toy guns to New York addresses, violating our laws and putting people at risk,” she said.
“The ban on realistic-looking toy guns is meant to keep New Yorkers safe and my office will not hesitate to hold any business that violates that law accountable.”
Walmart must pay $14,000 in penalties and $2,000 in fees under the settlement, the AG’s office said.
That total of $16,000 is a tiny fraction of the approximately $49 million in net income Walmart earned on an average day in the most recent financial quarter.
CNBC has requested comment from Walmart, which neither admitted nor denied the findings by James’ office in its investigation.
As part of the settlement, Walmart is required to prohibit third parties from offering for sale or selling any of the imitation guns covered by the state law to buyers in New York.
“Walmart shall terminate the ability of a third party from being able to list and sell toy guns and imitation weapons on Walmart.com when it has determined that a third party has engaged in conduct” that violates that restriction on three separate occasions, the settlement said.
And “Walmart shall implement and maintain policies and procedures reasonably designed to prevent such third parties from offering for sale, exposing for sale, or selling Prohibited Items on Walmart.com for importation, holding for sale, or distribution to New York,” the settlement says.
WIN Metals Ltd (ASX: WIN) (“WIN” or “the Company”) is pleased to announce an Exploration Target for the high-grade Golden Crown gold deposit, part of the Company’s Butchers Creek.
Highlights
WIN has defined an Exploration Target for Golden Crown of 400kt to 700kt tonnes between 2.4g/t to 3.2g/t Au for 23,000oz to 73,000oz of gold. This is in addition to the current Inferred Mineral Resource Estimate (MRE) of 400kt @ 3.1g/t Au for 38,000oz of gold1
The Exploration Target is supported by the successful 2024 drilling campaign, which tested mineralisation below current Inferred Resource at Golden Crown including2:
24BCRC014 – 6m @ 10.85g/t Au (140m below MRE)
24BCRC012 – 5m @ 3.63g/t Au (95m below MRE)
WIN remains focused on growing shareholder value through low-cost, high-impact drilling at the high-grade Golden Crown, complementing the recently announced 2025 Butchers Creek MRE update of 5.23Mt at 1.G1g/t Au for 321,000oz of gold
Heritage clearance results for the 2025 field program have now been received with no impediments to proposed drilling activities
Preparation work is underway to support a G,000m drilling program, with drilling scheduled to commence in July 2025
The potential quantity and grade of the Exploration Target is conceptual in nature and, as such, there has been insufficient exploration drilling conducted to estimate a Mineral Resource. At this stage it is uncertain if further exploration drilling will result in the estimation of a Mineral Resource. The Exploration Target has been prepared in accordance with the JORC Code (2012). This exploration target is exclusive of the 2021 Golden Crown Mineral resource estimate of 400kt at 3.10g/t Au for 38,000oz of gold.
Gold Project (“BCGP”) located in the East Kimberley region of Western Australia. The BCGP currently contains a global Mineral Resource of 5.63Mt @ 1.98g/t Au for 359,000oz of gold.
The Golden Crown Exploration Target, which lies below the current Inferred Resource, is estimated at between 400kt to 700kt @ 2.4g/t to 3.2g/t Au, representing an additional 23,000oz to 73,000oz of gold beyond the current MRE.
WIN Metals Managing Director and CEO, Mr Steve Norregaard, commented:
“The establishment of an Exploration Target at the high-grade Golden Crown gold deposit following our highly successful 4-hole drilling program late in 2024 marks another important milestone in WIN’s strategy to unlock value from the project. The potential for additional gold at Golden Crown represents a compelling resource growth opportunity that could see Golden Crown be a meaningful satellite producer complementing the main Butchers Creek body of mineralisation.
With a very targeted, low-cost exploration approach this supports our vision of becoming the next gold producer in Kimberley region of WA. The upcoming S,000m drill campaign is designed to test the potential and deliver further value to shareholders through disciplined, high-impact exploration. We’re suitably enthused by what lies ahead.”
Exploration Target Basis
During WIN’s 2024 drilling campaign, 4 holes for 873m were drilled at Golden Crown demonstrating the resource growth potential. In aggregate, 159 holes for 12,570m have been drilled at Golden Crown along the lightly tested 2km strike.
Highlights from WIN’s drilling included:
6m @ 10.85g/t Au from 253m in hole 24BCRC014 (140m below the Mineral Resource)
5m @ 3.63g/t Au from 222m in hole 24BCRC012 (95m below Mineral Resource)
2m @ 6.00g/t Au from 130m in hole 24BCRC013 (25m below Mineral Resource)
The Golden Crown Exploration Target was generated using the following parameters:
Mineralised envelopes have been remodelled at Golden Crown using Micromine software, with the new intercepts included at Golden Crown North from all holes drilled at the deposit
A 0.3g/t Au cut-off was applied to constrain the mineralisation envelopes
Mineralisation envelopes have been extended up to 250m below surface (130m RL) and extended a maximum of 60m radii along strike from a mineralised intercept
Volume of the mineralisation envelopes were converted to tonnage using a factor of 2.71t per cubic meter, consistent with the April 2025 MRE update for Butchers Creek
Upper and lower grade ranges were calculated at ±15% of the current MRE for Golden Crown of 3.10g/t Au. The southern extension mineralisation envelope, which was not modelled nor reported in 2021 MRE, has been assigned the average composite grade
Upper and lower tonnage ranges were calculated at ±15% of the updated mineralisation envelopes
The Exploration Target output range was rounded to the nearest 1,000oz to reflect the conceptual nature of this calculation
Heritage Clearance for 2025 Drilling Programme
All drilling proposed in the 2025 heritage survey has been approved by the Koongie Elvire Traditional Owners Group following the completion of a heritage survey in April. This approval enables WIN to accelerate its 2025 drilling programme, focusing on growing the Golden Crown resource and testing the EIS co-funded exploration target, Ganymede3.
Future Work
The 2025 field season has commenced with reconnaissance work underway, now both heritage survey and the necessary clearances have been received. The drilling program will primarily focus on resource growth at the Golden Crown gold deposit, with 9,000m of drilling planned to commence in June/July 2025. An updated MRE for Golden Crown is expected later in 2025.
Location and Project History
The Golden Crown gold deposit is within exploration licence E80/4976, which is 4.5km north of the Butchers Creek gold mine and 30km southeast of Halls Creek in the Kimberley region of Western Australia. The project is accessible via the Duncan Road that connects the BCGP to the town of Halls Creek and the Great Northern Highway.
Antilles Gold Limited (“Antilles Gold” or the “Company”) (ASX: AAU) advises that 50% owned Cuban joint venture mining company, Minera La Victoria SA, and a major global commodities trading house have signed two off-take agreements for the purchase of the gold concentrates and the copper/gold concentrates to be produced by the Nueva Sabana mine (“Nueva Sabana Mine”).
The proposed payables for metals outlined below are 12% higher for the gold concentrate, and the same for the copper/gold concentrate, that were included in the Nueva Sabana Pre-Feasibility Study (‘PFS’), the results of which were advised to ASX on 13 January 2025, together with the production schedule and target specifications for the two concentrates on market-based terms
Additional details on the commercial arrangements include the following:
For each offtake, provisional payment of 90% of provisional value of the concentrate 5 business days after shipment from the port of loading and buyer’s receipt of various original documents;
For each offtake, final invoice shall be issued after final assays, weights and prices are known, and final Payment shall be made within 5 business days of buyer’s receipt of the final invoice, less the provisional payment;
For each offtake, shipment to be approximately even spread throughout the calendar year in minimum bill of lading parcels of ~1,000dmt of concentrate (estimated to be equivalent to around two weeks of production from the Nueva Sabana Mine);
For each offtake, no minimum or maximum volume commitments; and
For each offtake, there are defined events of default which give rise to certain rights, including the right to suspend and/or terminate the offtake agreements.
The counterparty is a major global commodities trading house with a diverse portfolio including substantial interests in metals and minerals and an annual group revenue in excess of billions of dollars. The Company confirms that it does not consider the identity of the counterparty to be information that a reasonable person would expect to have a material effect on the price or value of the Company’s securities. The Company confirms that this announcement contains all material information relevant to assessing the impact of the off-take agreements on the price or value of the Company’s securities, and is not misleading by omission.
LISTING RULE CONFIRMATION
The Company confirms that all material assumptions underpinning the production target and the forecast financial information derived from the production target in the revised MRE for Nueva Sabana advised to ASX on 2 October 2024 continue to apply and have not materially changed.
The Company also confirms that it is not aware of any new information or data that materially affects the information included in previous market announcements and all material assumptions and technical parameters underpinning the mineral resources in the 13 January 2025 market announcement continue to apply and have not materially changed.
The Chairman of Antilles Gold, Mr Brian Johnson, commented“finalisation of the concentrate off-take agreements is a major step forward in arranging financing for the Nueva Sabana project, and positive negotiations are progressing with potential lenders for the construction of the mine.
The mine is fully permitted, and the aim is to finalise the financing within the next 3 months to allow construction commencement, with commissioning 12 months later”.